
Patient surveys
With the TOM app, running patient surveys has now become even easier, faster and more targeted than ever before.
Start survey now!Easier
Tom has 2.8 million user interactions per month, meaning you can use it to survey hard-to-reach target groups over the course of just a few days.
Faster
Thanks to the high-frequency app use and the anonymity of users, a TOM patient survey will provide analysable data in a matter of days.
More targeted
The TOM app allows you to collect data on even highly specific indications in no time at all. We will be able to tell you how many patients match your indication in no more than a matter of hours.
Patient surveys with TOM
Our video provides a brief and concise overview of the advantages of using TOM for patient surveys and how it works
What our users say

Manuela Bieli
Head of Customer Engagement & Marketing

‘TOM allowed us to conduct targeted patient surveys incredibly quickly and thereby save valuable time and costs.’
Previous patient surveys
more than 5 months
TOM patient surveys
11 days
Here’s how it works
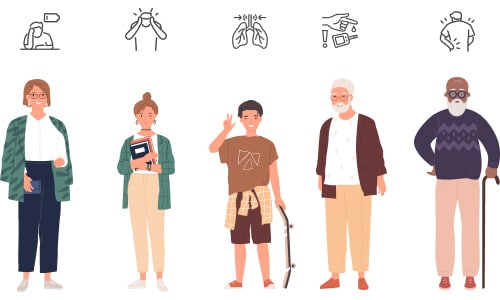
1. Select an indication
Tell TOM which target group you are interested in reaching. As we do not collect any personal data, you can address even the most specific drug indications and clinical pictures, while fully complying with data protection requirements.
2. Search for patients
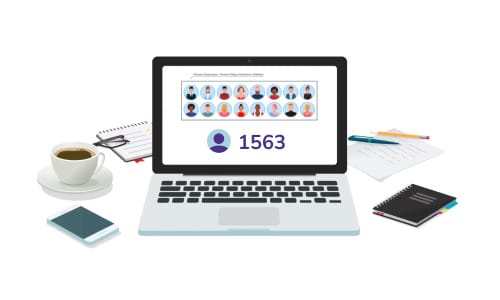
We will let you know within a few hours how many of our users meet your target group criteria. That way, you’ll already know roughly how many responses to expect before starting the survey.
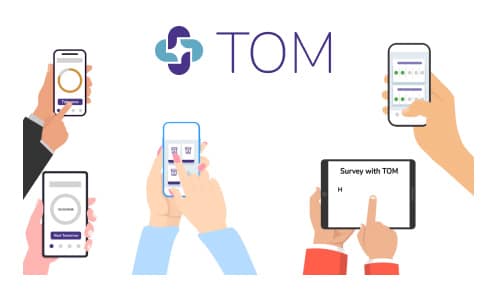
3. Run the patient survey
On average, our users interact with TOM about 10 times a day, meaning they will receive the survey within a few days at the latest.
And, because the anonymity of our users is guaranteed, you can use the data collected in any context without any concerns.
4. View the results
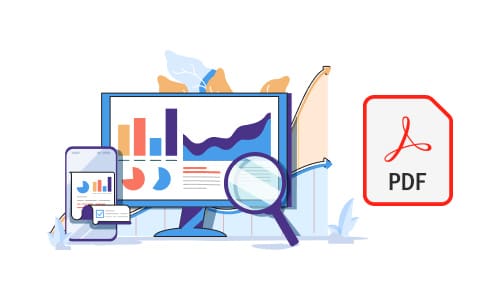
You will receive a PDF file with the aggregated survey results within just a few days of your anonymous survey’s completion.
If you opt for a paid survey, TOM will take care of all user incentives.
We would be happy to provide you with a non-binding quote for your patient survey!
TOM – statistically representative and legally compliant.
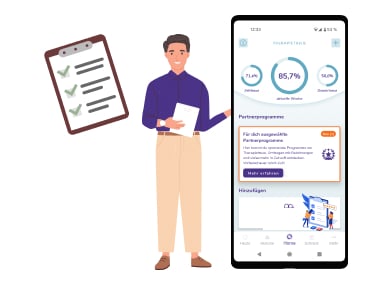
The TOM app allows you to directly and instantly survey your target group. Financial incentives boost response rates.
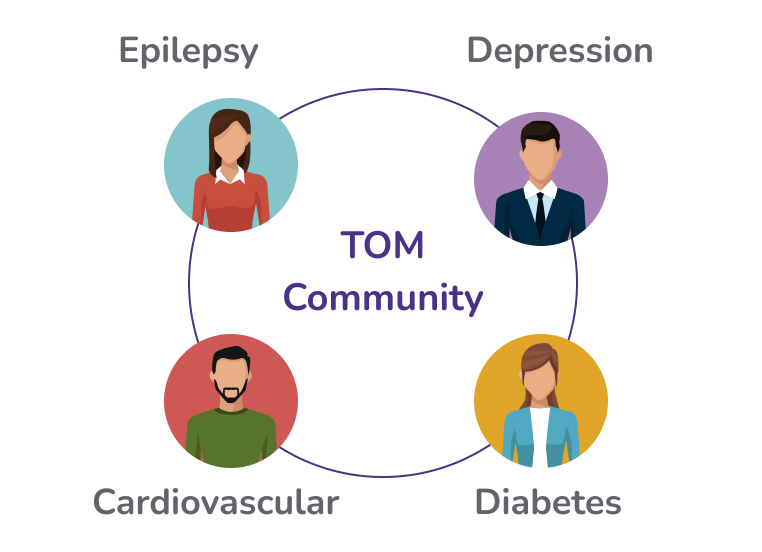
The TOM community makes it possible to run surveys for data on a wide range of indications and conditions in a very short timeframe.
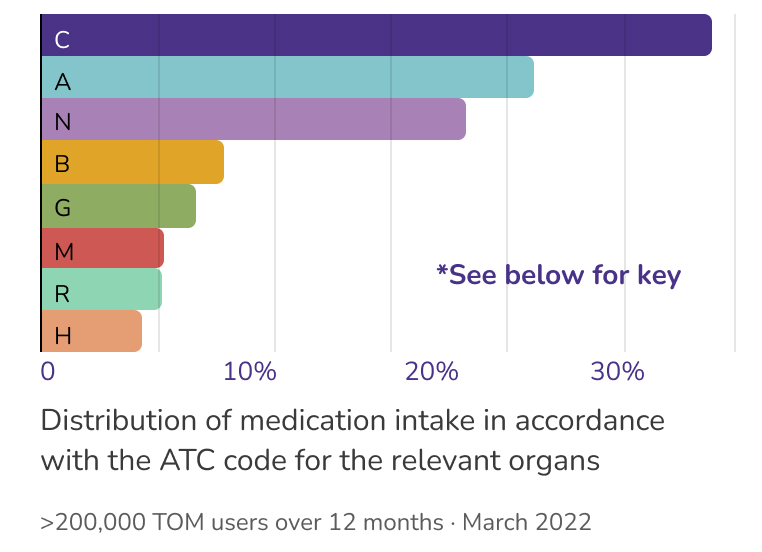
The frequency at which diseases are reported in the TOM app match their frequency across the population.
*Key for the distribution of medication intake in accordance with the ATC code
C: Cardiovascular system 29%, A: Alimentary tract and metabolism 21.4%, N: Nervous system 18.7% B: Blood and blood-forming organs 7.9%, G: Genito-urinary system and sex hormones 6.8%, M: Musculoskeletal system 5.8%, R: Respiratory system 5.6%, H: Systemic hormonal preparations 4.8%”
Request a patient survey
Make a free, no-obligation enquiry
